In Zoho CRM, what is a dashboard?
A Dashboard is among the many different modules included in Zoho Customer Relationship Management. So what is a dashboard? In Zoho terms, a dashboard is “a visual representation of custom reports that provide a real-time picture of your organization’s key metrics.” Today, dashboards are widely used in the business world, and knowing how to organize and navigate them is vital. They can help companies visualize and get deeper insight on their sales trends, inventory, marketing campaigns, etc.
Zoho has pre-built several dashboards and components for you right out of the box! These can easily be modified by editing or cloning to meet your needs. As with module views and reports, you can also create powerful reports and develop customized dashboard. The dashboard will be titled, and you will be able to choose whether to share it with other users.
A new look to Zoho CRM dashboard- Analytics
Zoho CRM Analytics, in its new incarnation, provides a visual representation of the company’s sales data.
Zoho CRM Dashboards is now called Analytics: a powerful new place for all the numbers that matter. In addition to its new name, Analytics introduces a wide range of analytical tools that will enable your company to shift from gut-feel to truly data-driven decision-making and compile your analytics into actionable insights.
A dashboard allows you to combine multiple reports on one page for a quick overview. Zoho CRM’s dashboard features two-dimensional and three-dimensional (2D/3D) charts, which are generated dynamically and built with Macromedia Flash technology. Among the most useful charts is a funnel chart, which can be used to understand the sales process intuitively at different stages.
In Zoho CRM, how do I set up a dashboard?
The dashboard module of Zoho CRM allows users to customize their dashboards based on their preferences. Data related to sales, marketing, support, and inventory can easily be visualized using dashboards. This simplifies dashboards and makes them more appealing.
Let’s start with your first dashboard
The first step in setting up a dashboard is to make sure you have a folder to store it in. Dashboards can be stored in either a public folder that is available to all users within the organization, or in a private folder with restricted access based on the rules and permissions for the folder. The next step will be to configure a dashboard.
Dashboard module
Step 1. Making Dashboard Folders
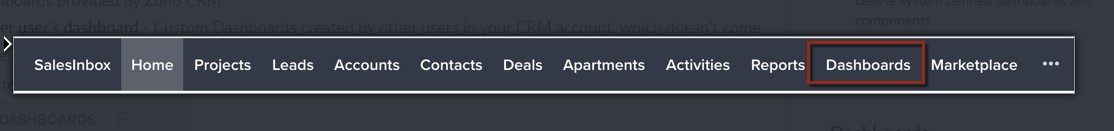
The Dashboards tab will appear on the module bar after you enter Zoho CRM. A link named “Go to Dashboard List” is located in the dashboards module. This link will take you to a page that shows all of your folders and dashboards within them. The “Create New Dashboard Folder” link allows you to create a new folder from this page. A new folder’s accessibility rules can be set when completing the folder’s information.
Step 2. Configuring the Dashboard
Dashboards can only be created with reports, so you must know which reports to pull data from. In the Dashboards module, click on “Go to Dashboard List”. Then, select “Create New Dashboard”.
When the dashboard page is displayed, you will need to enter the desired name for the dashboard, choose the folder where you want to store the dashboard, and then enter the description of the dashboard. The dashboard is created when you click “Save”.
Step 3. Inserting Components into the Dashboard
Adding component to dashboard
The dashboard creation does not mean that the data has been added to it. Adding components to the dashboard will allow it to display the data you want to see.
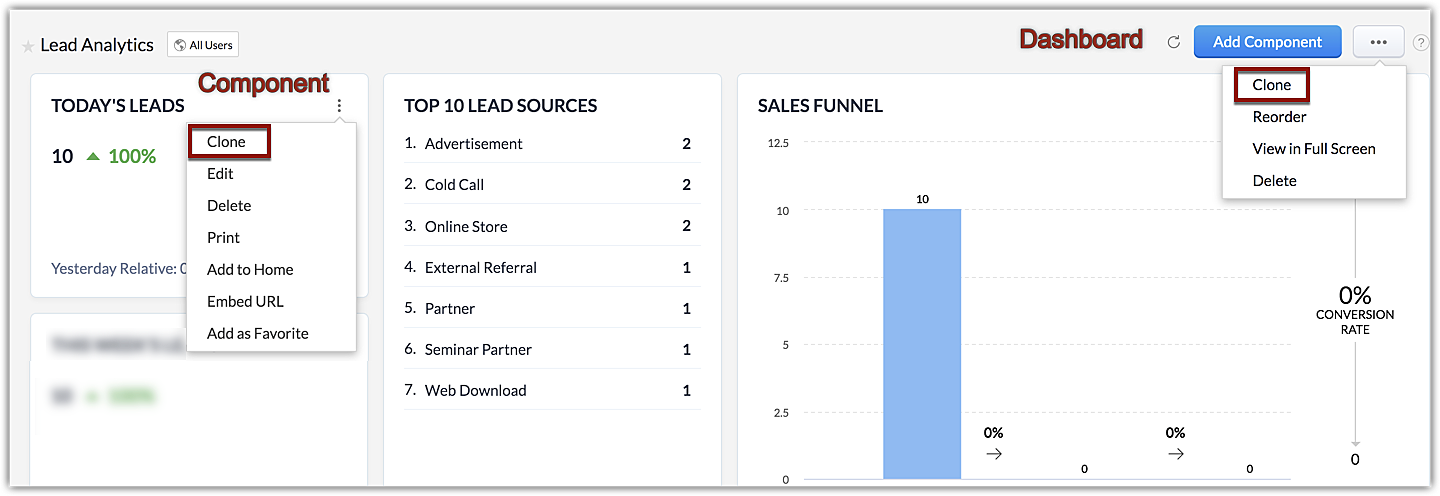
The newly created dashboard will be accessible from the Dashboards module’s dropdown menu. Choose the dashboard you want. When you select this option, you will notice no data is available. Select “Add Component” to add data.
The “Add Component” page has two options: charts and table views. In the next step, you will specify the component name and then select the report you want to see. Selecting “Next” after defining the details of the component will lead you to a different page depending on the component type. If the component is a chart (e.g., a bar graph, a pie chart, etc. ), then you will have to select the type of chart you would like to see. On the next page, you will be asked to specify the column details for your table, such as which columns you want to see or keep hidden.
In most cases, users prefer to use charts for a component type, since this gives a report a visual appeal.
When all the details have been specified, select “Finish,” and you’re done! Your dashboard is ready. It’s that simple.
10 tips to help you use the Zoho CRM dashboard
Ideally, a CRM system with this much data should not be limited to just a set of customer records, but should be able to generate insights on what to do next based on its power. Furthermore, businesses are looking for new ways to apply data analytics to help internal teams, like sales, marketing teams, and support, be more effective. As you can see, there is a need for analytics tools built into CRM systems, and we are going to share some tips on how to get most from Zoho CRM dashboard.
#TIP No.1 Creating charts with a single step.

Chart creation
The introduction of instant charts simplifies the process of data visualization even further. Charts are the simplest yet most sophisticated form of data visualization. Users can easily distinguish patterns, trends, etc., from the data, which would otherwise be confusing. Analytics dashboards now have the option to create charts instantly, without the need to select a report first. That’s quick!
#TIP NO.2 Organize KPI dashboards at one place.
KPI Dashboard
Running a successful business today requires tracking key performance indicators. Maintaining a close eye on KPIs will allow you to intervene quickly to make the necessary changes to keep the activities at your company aligned to what is necessary for growth and profitability.
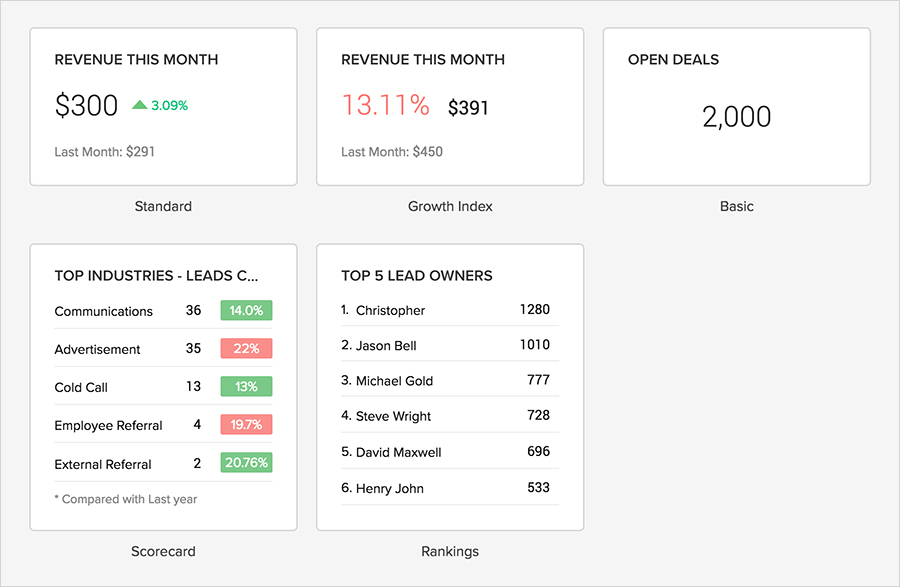
In addition to providing useful analytics for increasing sales personnel’s productivity, key performance indicators (KPIs) are standard measures that show how well your sales team is meeting important business goals. Allowing sales managers to analyze team performance across different geographies. As an example, a sales manager may want to monitor the top 10 sales rep based on the average annual revenue each of them has generated. Using the average annual revenue as the KPI metric, he can easily achieve this by creating a ranking style KPI.
There are five types of KPI styles you can choose from, according to your industry requirements:
- Standard
- Growth Index
- Basic
- Scorecard
- Rankings – Data can be ranked by day, calendar week, fiscal week, month, fiscal quarter, and year.
#TIP NO. 3 Make comparisons instantly
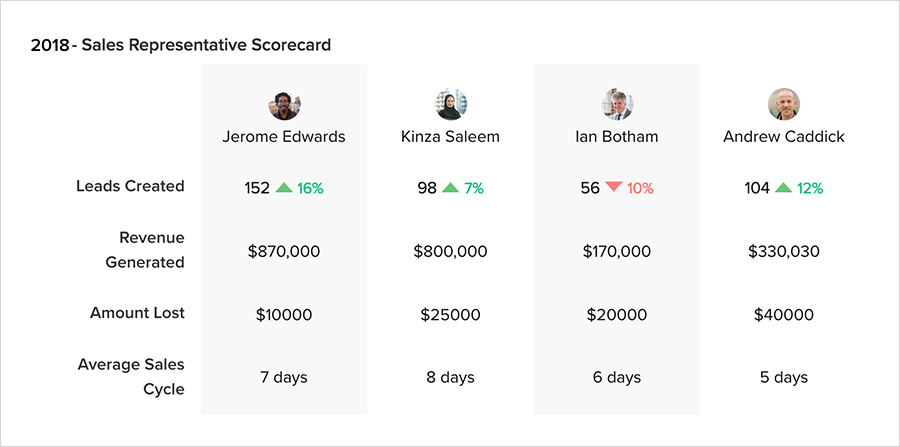
Comparators dashboard
If you’ve ever wanted to compare a variety of CRM metrics on one platform, we’ve got just the thing for you-comparators. Get a comprehensive overview in minutes by creating comparisons between users, time periods, or values in your CRM modules. It’s that quick and easy.
#TIP NO. 4 Helps in simplifying business data.
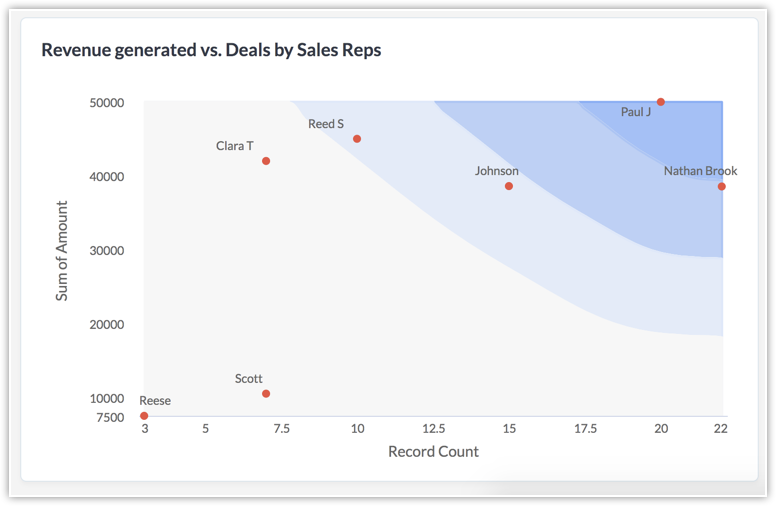
Zone Analysis
A CRM database is powerful because it is typically kept current and provides the most actionable intelligence about both individual key accounts and overall sales performance. A company’s CRM account includes a huge amount of business-related information, including customers’ interests, customer behavior and buying patterns, sales cycle duration, rate of completion of sales activity, and sales velocity.
Among the many analytic tools in CRM, users can decode business data into graphical forms that are easy to understand and can be shared across the organization. Zones is one of these tools which plots data points on a graphical area based on the most to least optimal conditions.
#TIP NO. 5 Easy to analyze pool of data
An important benefit of CRM dashboards is that they provide access to information quickly. It would be difficult to analyze vital data if there was too much information added.
With a limited set of business data, charts or KPIs are good for measuring or comparing, but if you have a great deal of data, a quadrant analysis may be more suitable for pinpointing the areas to focus on.
The quadrant analysis divides the data that you wish to measure or analyze into four quadrants. For example, you can analyze the types of campaigns versus the revenue generated to identify the most effective campaigns, or lead sources versus the leads created to determine where your company’s leads are coming from.
#TIP NO.6 Stay informed about business trends.
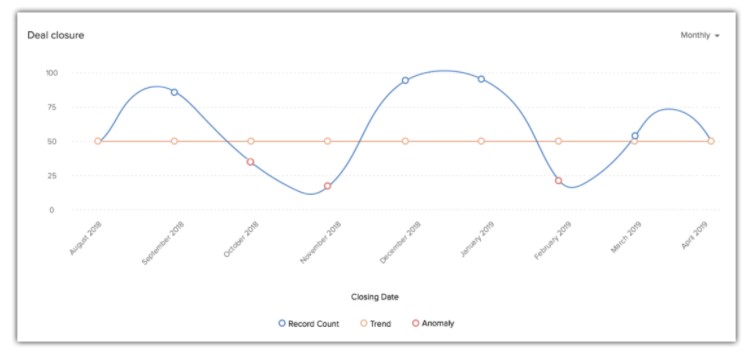
Anomaly detection
An anomaly detection approach aims to identify behavior that is unusual or out of the ordinary for a business. For instance, a dip in sales, loss rates, a drop in leads, or an increase in students canceling courses can be indicative of a negative deviation from the norm.
An anomaly detection can provide valuable insights into the business’s trends, which can be crucial in influencing key decisions. Making changes in existing processes or incorporating new ideas can be beneficial to the health of a business.
The anomaly detector in Zoho CRM helps you detect deviations by integrating the real-time data into an expected pattern and flagging information that lies outside the pattern. Zia’s intelligent anomaly detection will also help you align your current performance with your expected results, not just your past performances.
Some anomalies you can spot in Zoho CRM include:
- Alter customer engagement activities based on frequency of closing deals.
- Replenish inventory when product demand increases.
- Respond quickly to customer complaints.
- Improve site traffic.
#TIP NO. 7 Tracking the end-to-end pipeline

Funnel style
The pipeline is one of the most crucial aspects of a sales process and you can keep track of sales pipeline with Funnel chart. In a funnel, data is organized according to the stages of the business process. A healthy sales pipeline is maintained by identifying weak spots and allocating resources to them. Sales funnels can provide you with details like specific sales stages that you should target, a stage-wise drop rate in lead conversion rates, the number of leads/prospects at each level, etc. This kind of information can help you plan your upcoming sales activities.
The following 5 funnels can be selected depending on your business needs:
- Standard
- Compact
- Segment
- Classic
- Path
#TIP NO. 8 Align and achieve your target
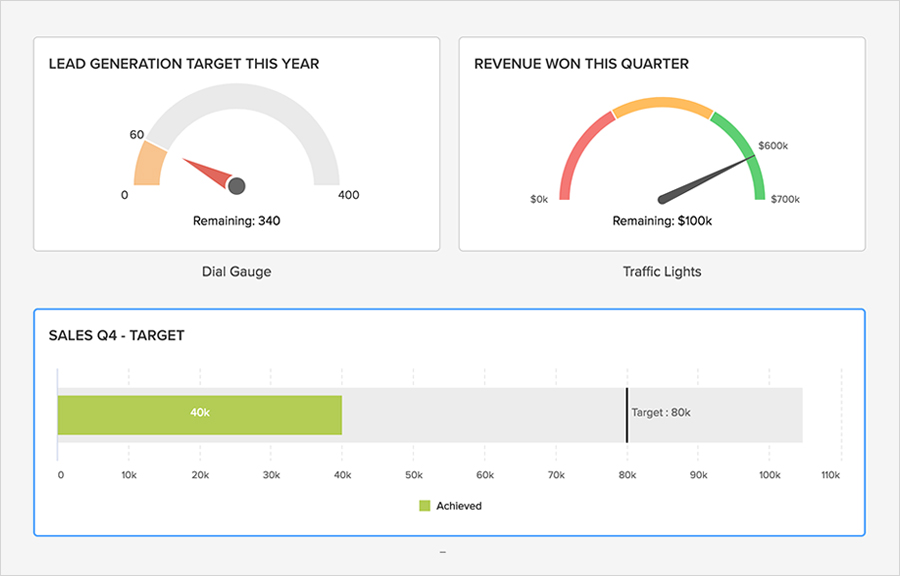
Target Meter
Which are the key details about your business that you would want to stay informed about? What targets are relevant to your long-term objectives? Having a target meter in your analytics arsenal makes sure that your sales team is always focused on what they should be aiming for. Setting and monitoring sales targets is easy with a target meter. The number of leads generated in the current quarter, revenue for the last quarter, and sales target for the past few months can all be viewed. Rather than running through piles of reports, all you need to do is choose a target meter, define the relevant parameters, and get the information.
#TIP NO. 9 Make use of group sharing.

Dashboard Visibility
Teamwork is essential to achieving success in the workplace. Dashboard offers a powerful tool that allows you to share content with others. Its group sharing feature is often overlooked by Zoho users. Sales persons can make data-driven conversations a daily reality through group sharing.
The platform allows for real-time analysis of sales stages and business operations. Dashboards can be created and shared with all users or a few selected ones. They can also be created privately so that only you can access them.
The dashboards can be customized according to your business needs, providing you with an overview of various business activities such as email analytics, lead status, marketing metrics, activity status, activity report etc. These dashboards can also be shared with selected or all users in your organization.
For example, if you create chart for industry-wise revenue and share with all users, only those users who have the permission to view the Industry field will be able to see the chart.
#TIP NO. 10 Take Advantage of Embed URL
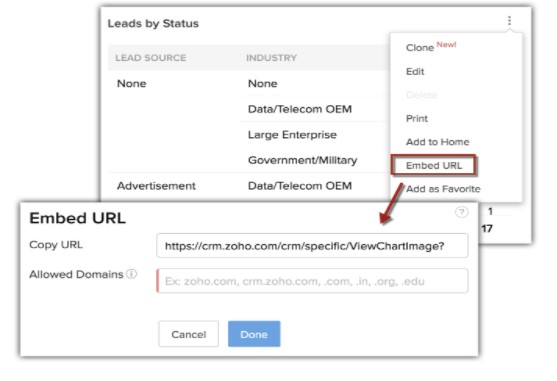
Embed URL
It is possible to embed the dashboard in any website by copying its URL and pasting it in the desired location. The dashboard can be restricted to specific domains by setting them as allowed domains. In the allowed domains section, you can mention .edu if you want a chart to only be displayed in that domain. This will prevent users from viewing that chart from other domains.
Bottom line- Getting the Most Out of your Zoho Dashboard
For sales representatives, business owners, and anyone else who makes informed business decisions based on data, Zoho CRM dashboards are an invaluable resource. A Zoho CRM dashboard not only provides a snapshot of key metrics in a visual format that’s easy to understand, it’s also pretty easy to set up once you’ve decided what metrics to monitor. Create your own CRM dashboards to help you make the right and smarter business decisions.
With Zoho CRM dashboards, any organization can improve the use of data across all sources. Using data to guide decisions and supervise performance can lead to dramatic increases in productivity.
To know more about Zoho CRM contact us. We have helped customers get the most from Zoho products as a Zoho Partner and a solution provider of choice. As we are serving our clients in various parts of the globe.

